Smit Topiwala
Foreign Direct Investment in India
Built two Tableau dashboards analyzing 17 years of sector-wise FDI data in India (2000–2017). Tracked how foreign investment shifted across sectors and over time, including forecasts for the following year.
Tools: Tableau, data visualization, time-series forecasting
Live dashboards: Dashboard 1 · Dashboard 2
Repo: GitHub
Key Visualizations
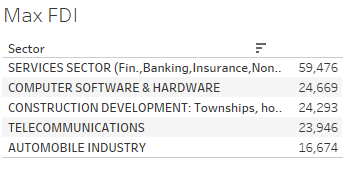
Maximum FDI
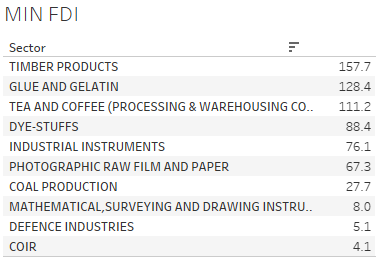
Minimum FDI
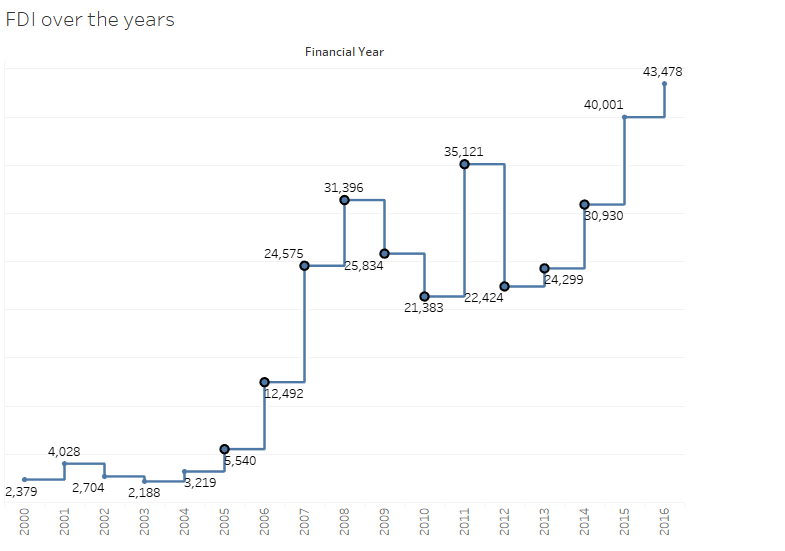
FDI over the years
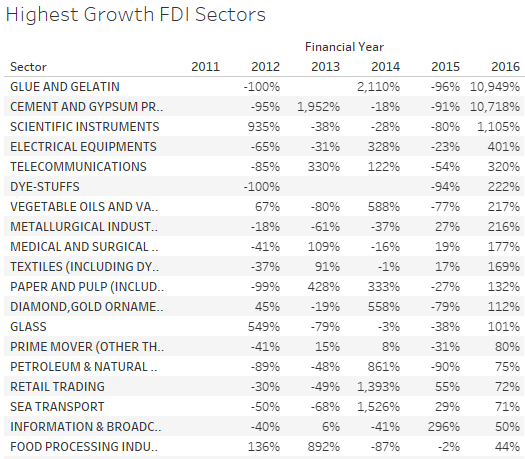
Highest growth FDI sectors
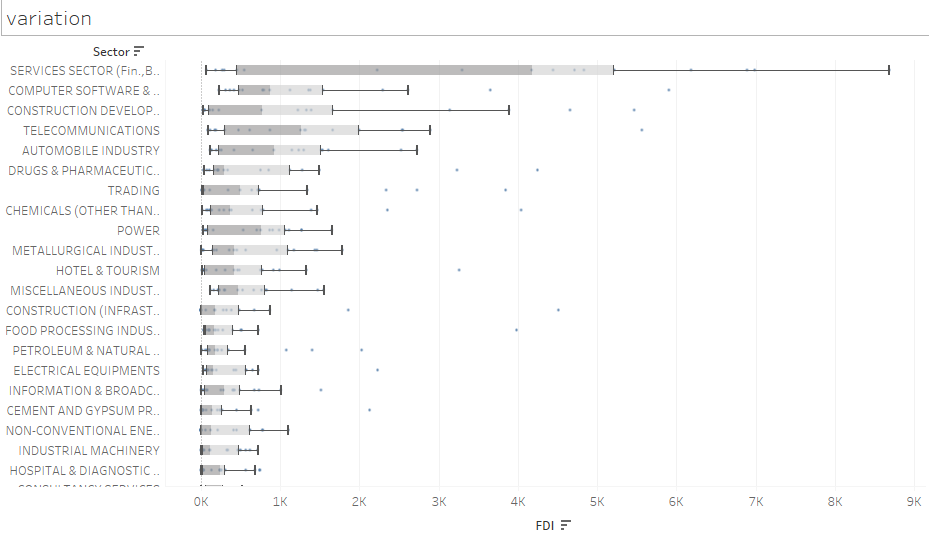
Variation of FDI across sectors
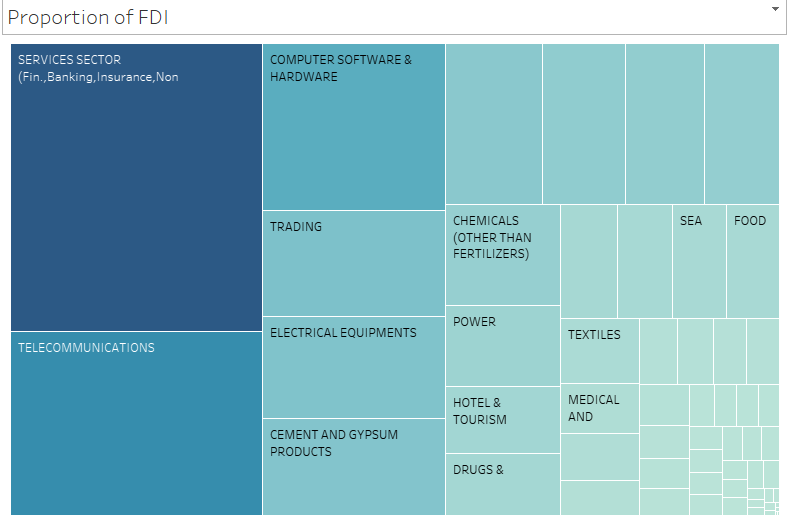
Proportion of FDI
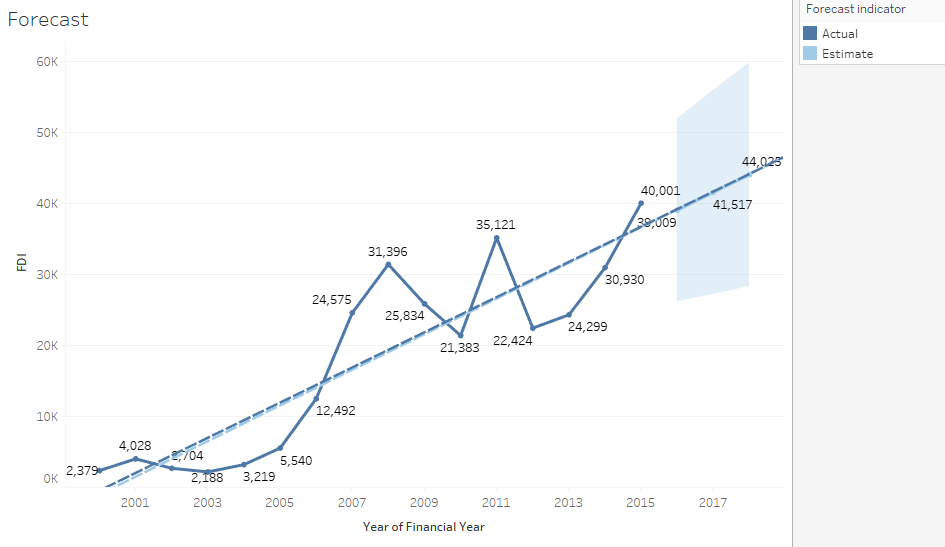
Forecast for next year