Smit Topiwala

Airbnb Listing Analysis
Explored Seattle Airbnb listing data to understand how price, inventory, and revenue vary by neighborhood, bedroom count, and time. Built an interactive Tableau dashboard combining geospatial maps, bar charts, and time-series views to surface pricing hotspots and market trends.
Tools: Tableau, geospatial analysis, pricing analytics
Live dashboard: Airbnb Listings Dashboard
Key Visualizations
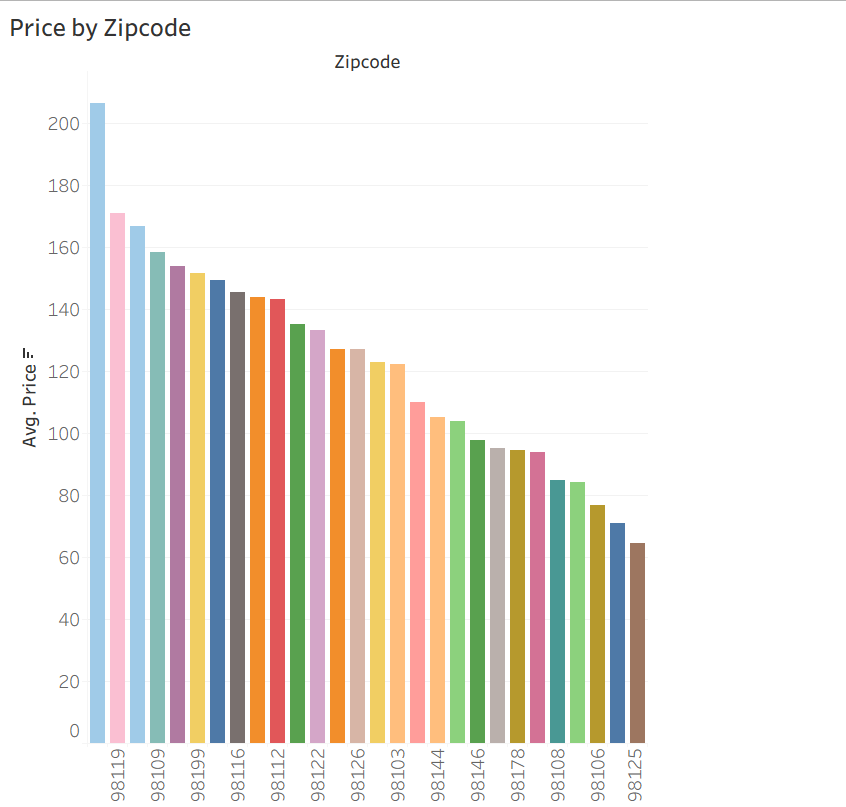
Price by zip code
Average nightly price ranked across Seattle zip codes. 98119 leads at over $200/night while more affordable areas fall near $65–$75.
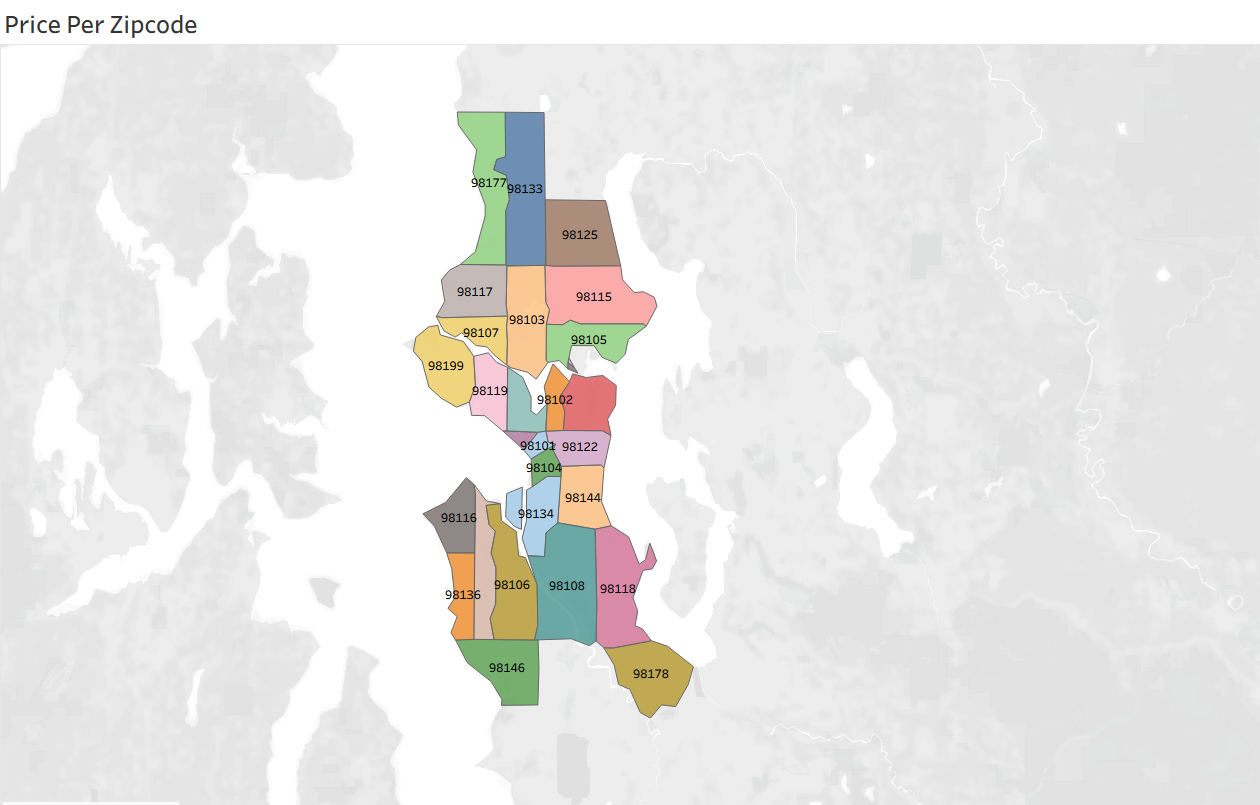
Price per zip code (map)
Choropleth map of Seattle neighborhoods colored by zip code, making it easy to compare pricing patterns across the city at a glance.
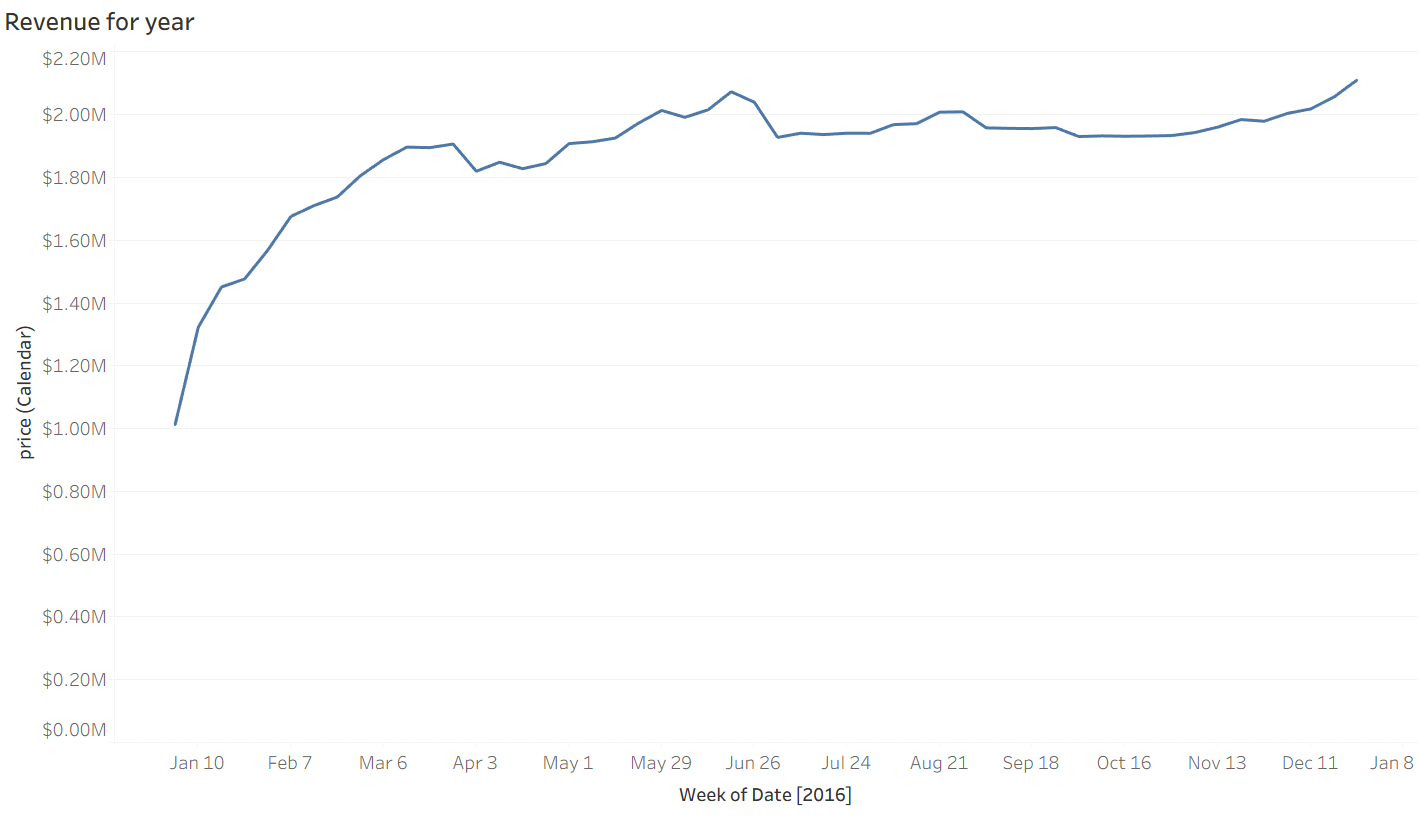
Revenue for year
Weekly calendar revenue through 2016. Strong growth in Q1, a summer peak near $2.1M, and a year-end surge above $2.15M.
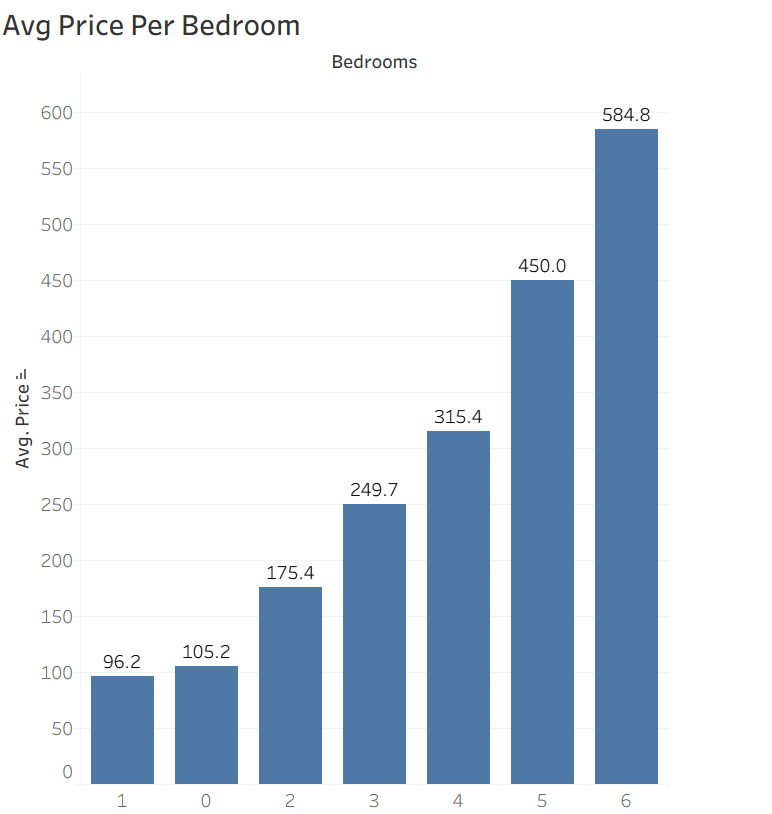
Avg price per bedroom
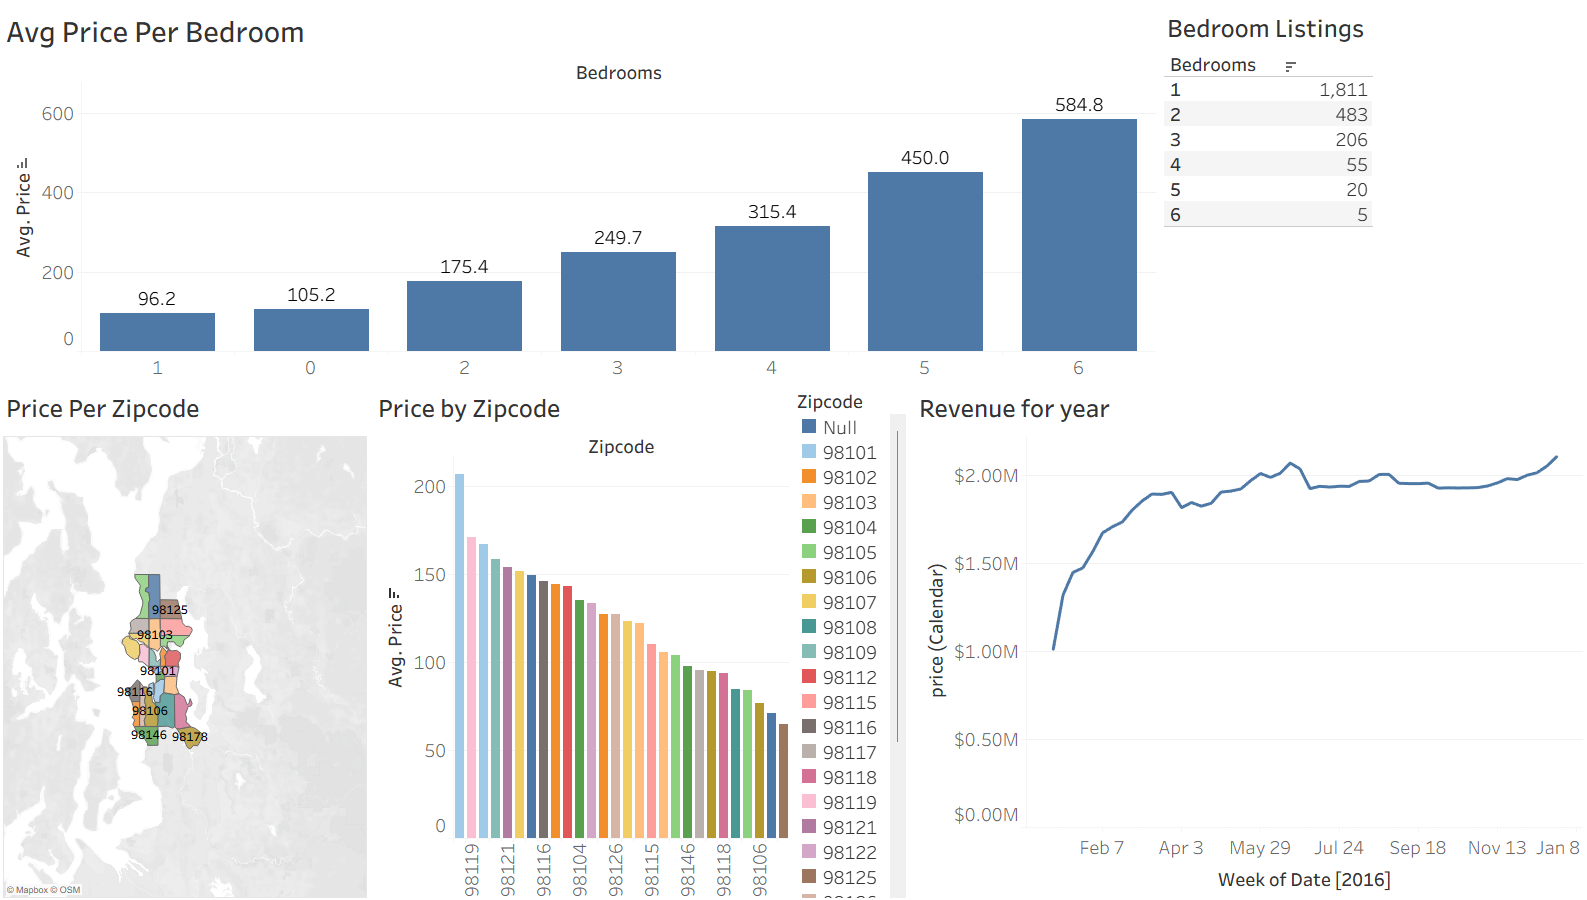
Clear price ladder from studios (~$105) through 6-bedroom homes (~$585); larger properties command a steep premium for groups and families.
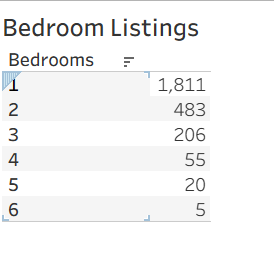
Bedroom listings
Inventory is dominated by 1-bedroom units (1,811 listings), with supply dropping sharply for 4+ bedroom properties.
Full dashboard
All five views combined into one interactive dashboard with filters for exploring price, location, and revenue together.