Smit Topiwala

Organization Dashboard
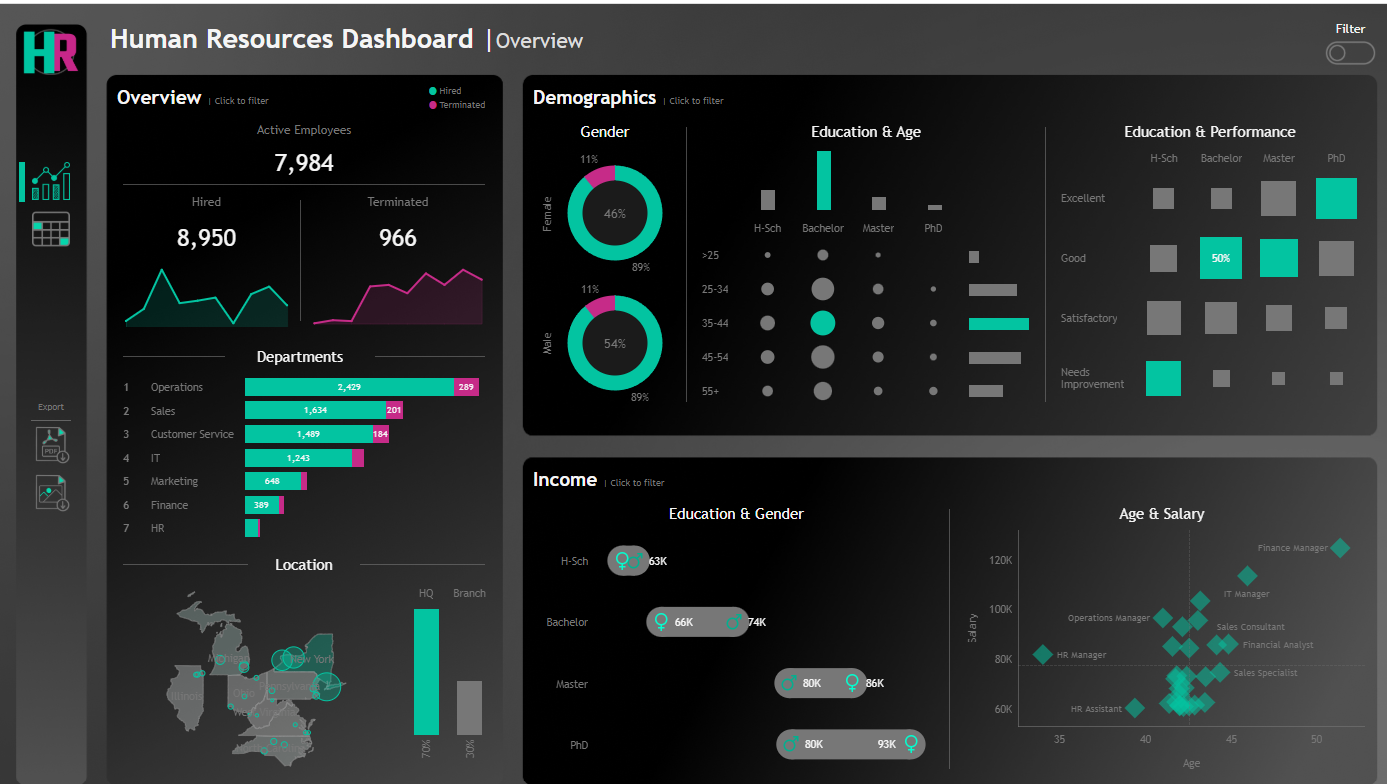
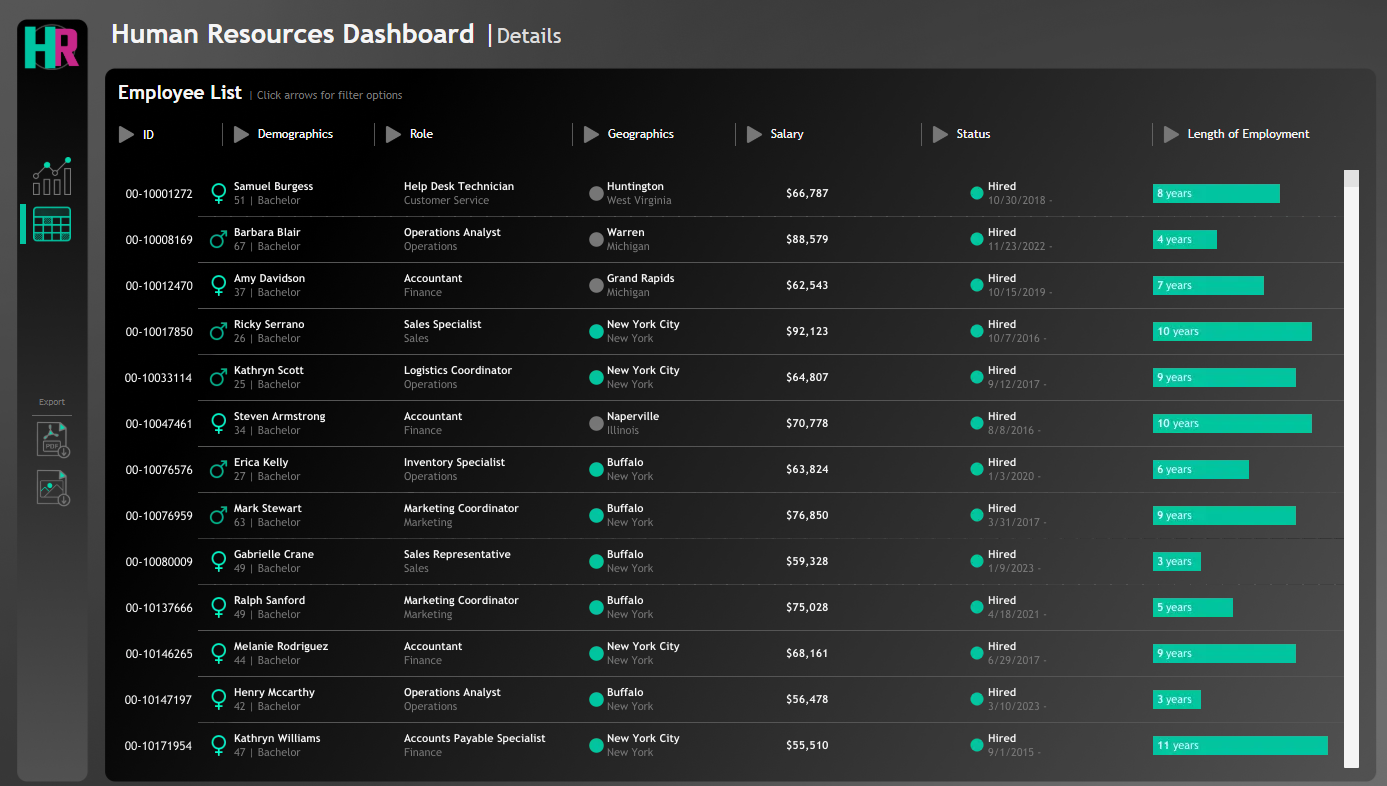
Built a two-part Tableau HR analytics suite for workforce planning: a summary dashboard for leadership KPIs and demographics, and a details view for drilling into individual employee records. Together they cover headcount, hiring and attrition, department mix, compensation, and tenure.
Tools: Tableau, HR analytics, workforce reporting
Live dashboards: HR Summary · HR Details
Key Visualizations
HR Summary dashboard
Executive overview with 7,984 active employees, hiring vs. termination trends, and department breakdown. Operations leads headcount (~2,429 active), with most staff at HQ (70%) vs. branch offices (30%). Demographics cover gender split (54% male / 46% female), education and age mix, performance by degree, and salary patterns across education, gender, and role.
HR Details dashboard
Searchable employee table with ID, demographics, role, location, salary, hire status, and tenure bars for quick comparison. Supports filtering on each column so HR teams can slice the workforce by department, geography, or compensation band.
Links
Dashboard creation inspired by and based on a YouTube tutorial from the Data With Baraa YouTube channel.