Smit Topiwala

Company Customer and Sales Report
Built paired Tableau dashboards for 2023 business performance: a customer view tracking acquisition, order frequency, and top accounts, and a sales view covering revenue, profit, quantity, and subcategory trends. Year-over-year comparisons and monthly sparklines highlight growth patterns and areas needing attention.
Tools: Tableau, sales analytics, customer analytics
Live dashboards: Customer Dashboard · Sales Dashboard
Key Visualizations
Customer dashboard
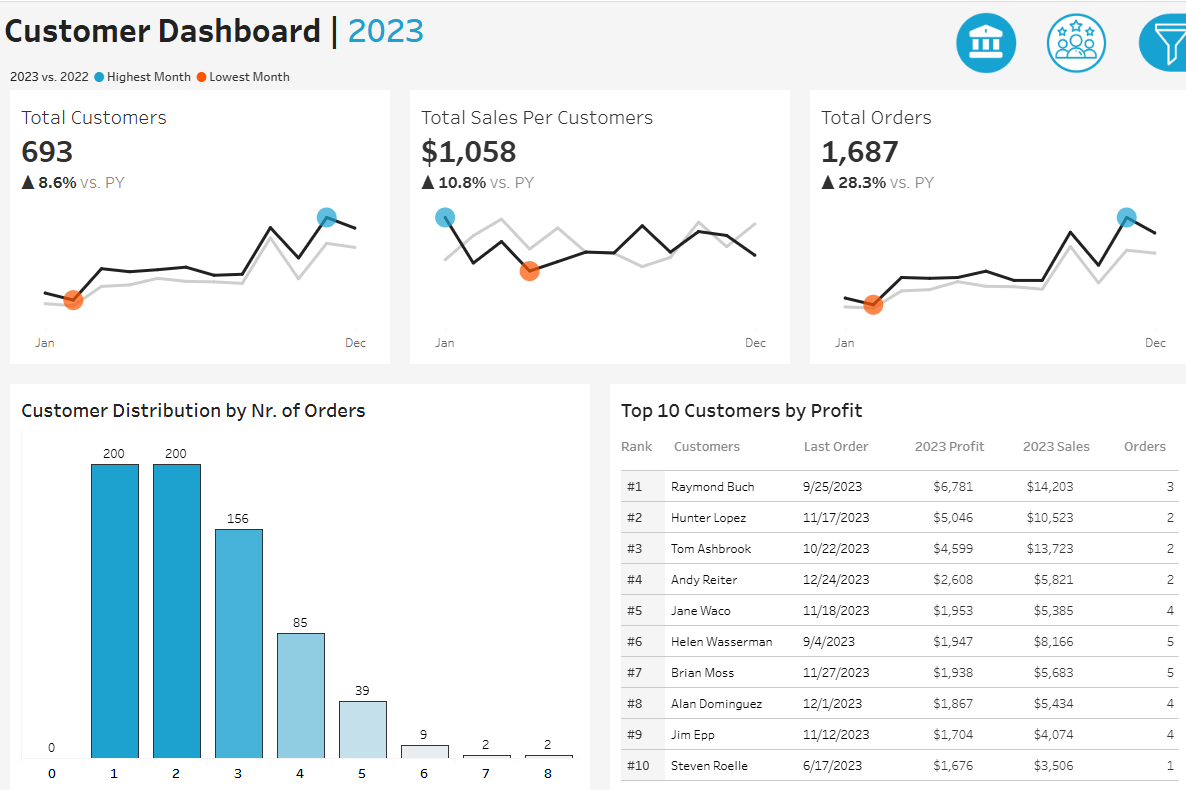
2023 customer KPIs: 693 total customers (+8.6% vs. prior year), $1,058 sales per customer (+10.8%), and 1,687 orders (+28.3%). Monthly sparklines compare 2023 to 2022. Order-frequency bars show most customers place 1–2 orders, while a top-10 table ranks accounts by profit (Raymond Buch leads at $6,781 profit).
Sales dashboard
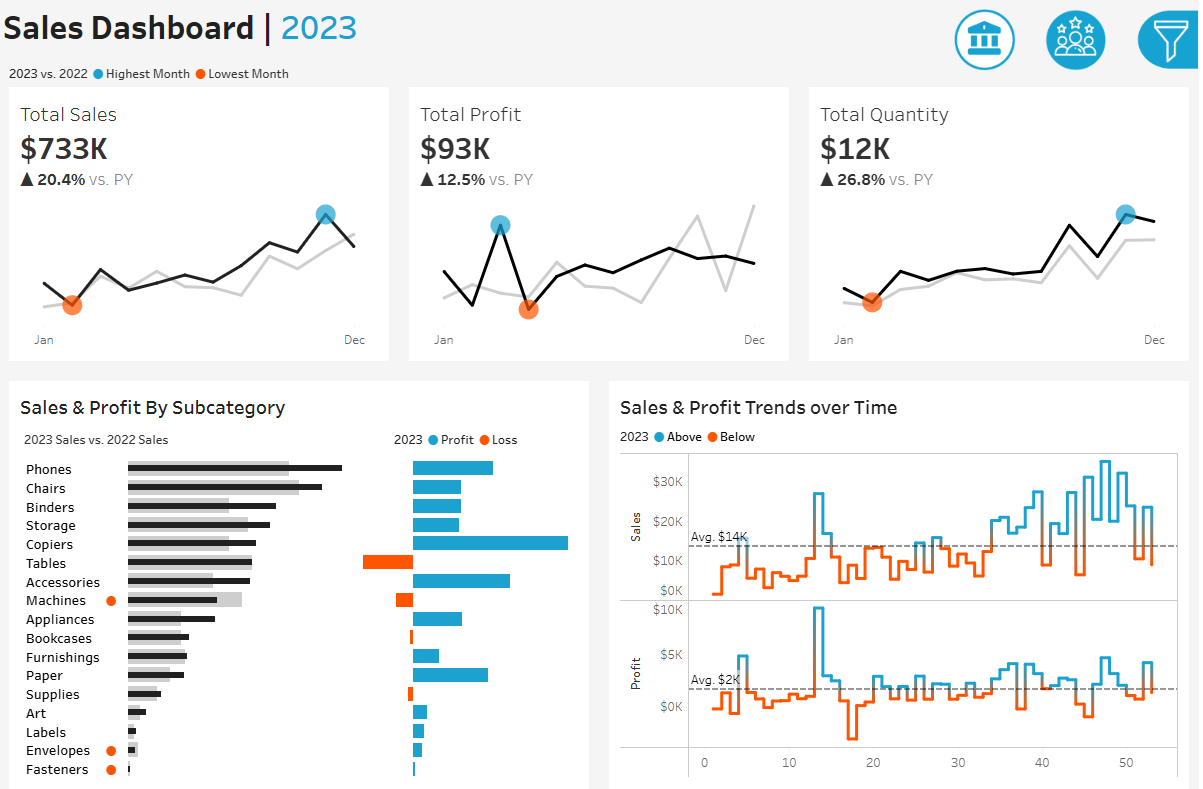
2023 sales KPIs: $733K total sales (+20.4%), $93K profit (+12.5%), and 12K units sold (+26.8%). Subcategory bars compare 2023 vs. 2022 sales; profit/loss highlights strong performers (Copiers, Accessories) vs. loss categories (Tables, Machines). Weekly step charts track sales and profit against averages, flagging mid-year dips and year-end recovery.
Links
Dashboard creation inspired by and based on a YouTube tutorial from the Data With Baraa YouTube channel.