Smit Topiwala
• MS in Data Science graduate from University of Alabama at Birmingham.
• I am passionate about building impactful data products and learning the best coding practices for data science.
• Solid background in Python programming, statistics, and machine learning algorithms.
• Interested in Data Engineer/Data Science/Data Analytics/Business Research Analyst/Market research Analyst opportunities.
Project Description:
In this project, I have analyzed the Uber Pickups in New York City. The dataset is obtained from the kaggle. New York City has five boroughs: Brooklyn, Queens, Manhattan, Bronx, and Staten Island. I have applied K means clustering algorithm to understand the trips taken on uber in New York City.
Images
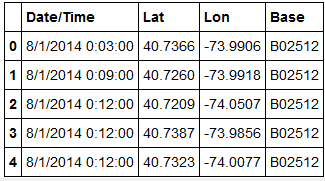
1. There are 4 columns in the data and 829,275 observations. Only a few observations are shown here.
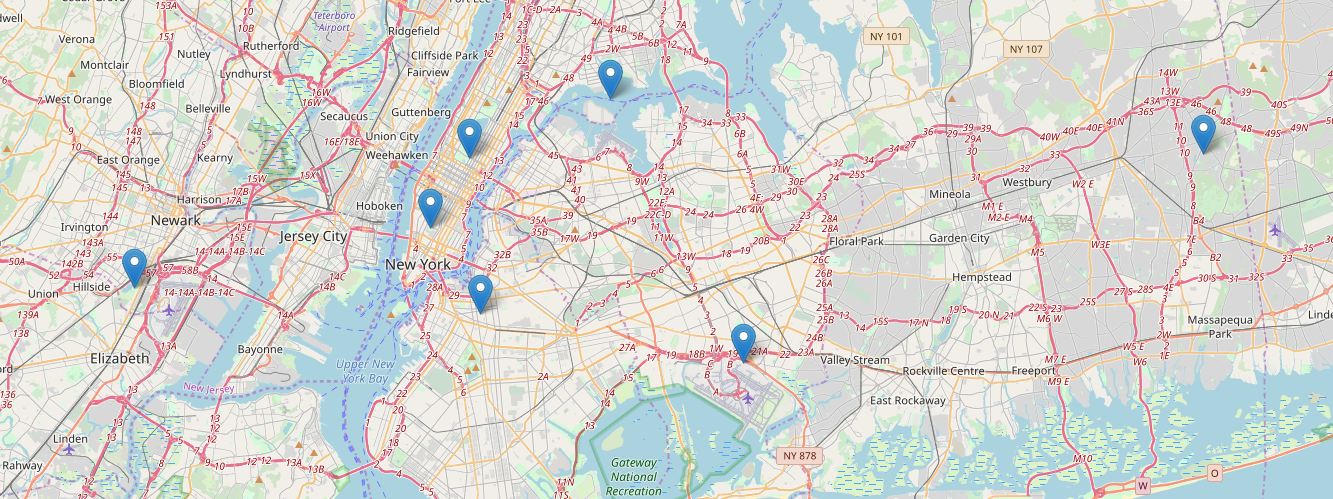
2. All seven centroids are plotted on the map which can act as a hub for the new requested uber rides.
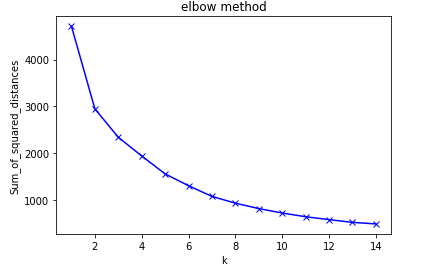
3. Elbow method is used to find the optimal value of k by fitting the model with a range of values for K
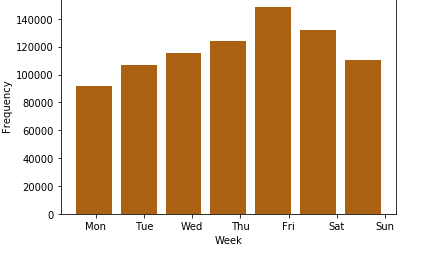
4. Analyzing the data by weekday and Frequency.
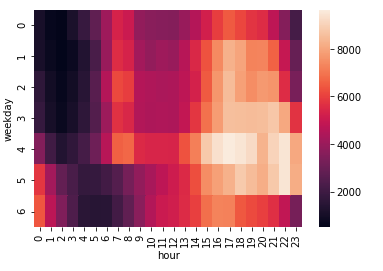
5. Analyzing hour and day together using seaborn chart.
For more details see Analysis of Uber trips.