Smit Topiwala

Uber NYC Pickup Analysis
Analyzed 829,275 Uber pickup records across New York City’s five boroughs using K-Means clustering to identify high-demand ride hubs and understand temporal pickup patterns.
Tools: Python, K-Means, pandas, seaborn, geospatial visualization
Repo: GitHub
Key Visualizations
Dataset overview
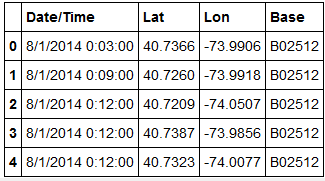
Four columns and 829K+ observations covering pickup locations across NYC boroughs.
Cluster centroids on map
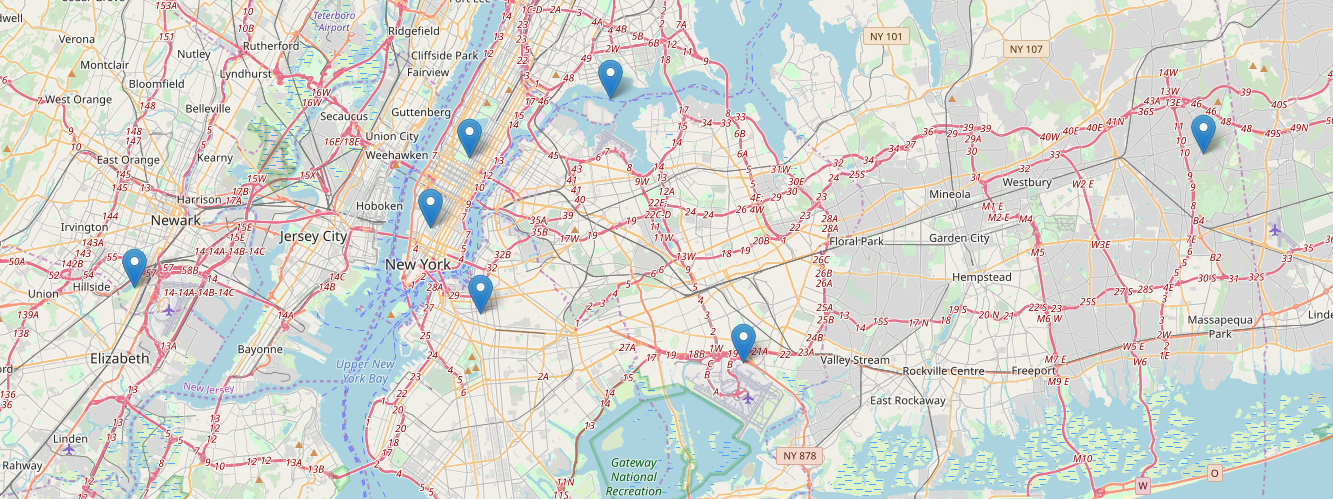
Seven centroids plotted as potential hub locations for new ride requests.
Elbow method for optimal K
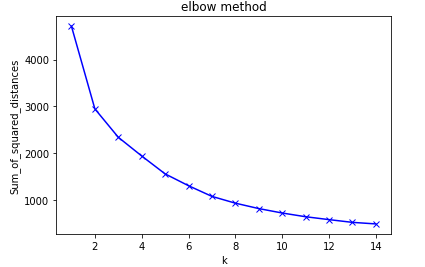
Used the elbow method to determine the optimal number of clusters.
Weekday and frequency analysis
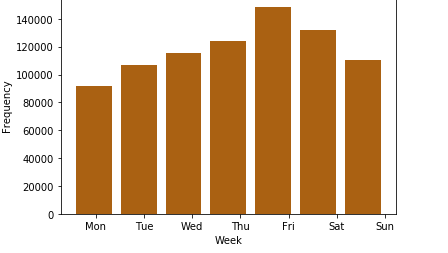
Pickup frequency patterns broken down by day of the week.
Hour and day heatmap
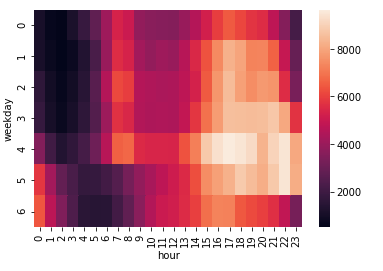
Combined hour-of-day and day-of-week analysis using seaborn.
Key Results
- Identified 7 geographic clusters representing high-demand pickup zones
- Revealed weekday vs. weekend demand differences
- Mapped hourly pickup intensity to inform fleet positioning